Fractional CMO KPIs should show whether marketing is creating revenue, improving acquisition efficiency, and helping sales close better-fit customers. The most useful KPIs go beyond clicks, impressions, and lead volume. They connect marketing activity to pipeline, ARR, CAC, retention, and win rates.
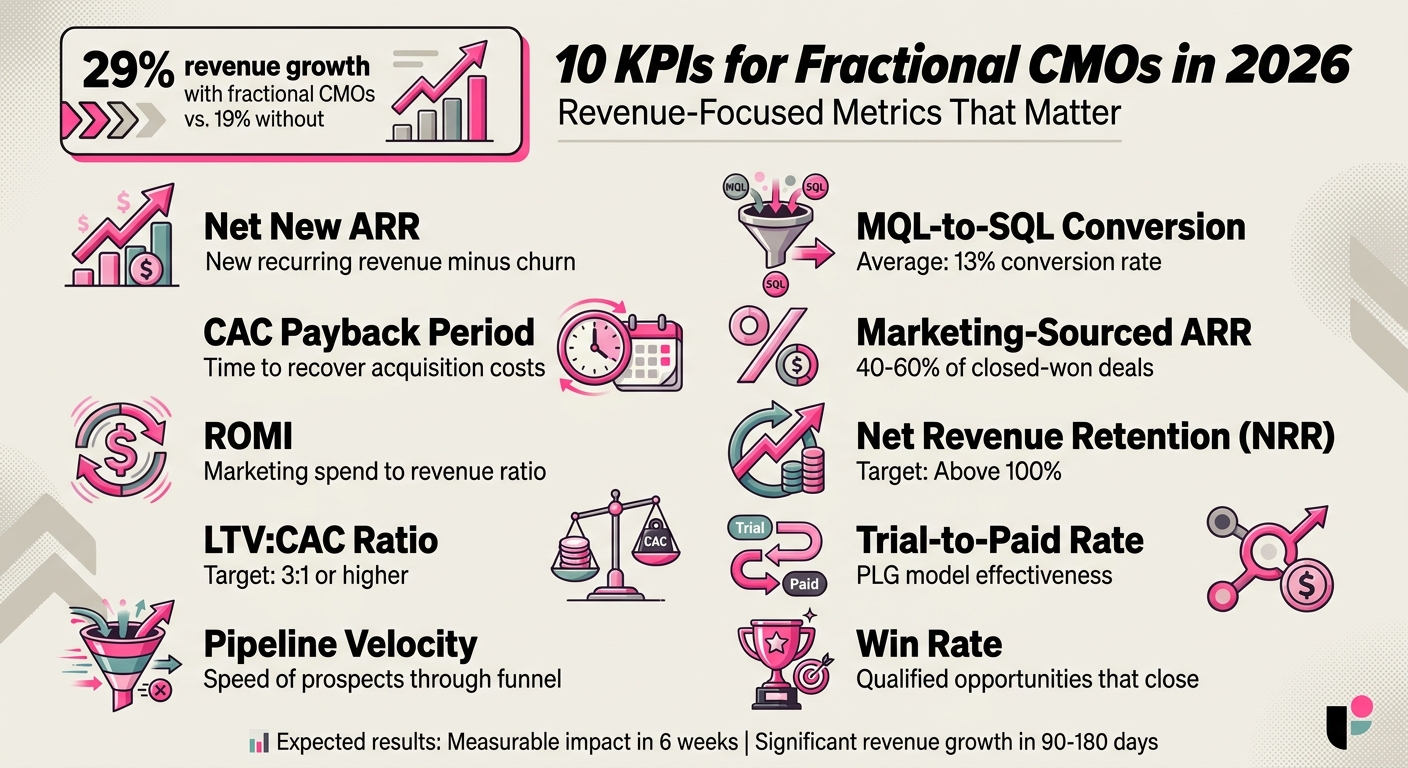
Below are 10 KPIs fractional CMOs should track in 2026 to prove impact, prioritize the right work, and report meaningful progress to CEOs, founders, and boards:
- Net New ARR: Tracks new recurring revenue minus churn.
- CAC Payback Period: Measures how quickly customer acquisition costs are recovered.
- Return on Marketing Investment (ROMI): Links marketing spend to revenue.
- LTV:CAC Ratio: Compares customer lifetime value to acquisition cost.
- Pipeline Velocity: Shows how quickly prospects move through the sales funnel.
- MQL-to-SQL Conversion Rate: Evaluates lead quality and sales acceptance.
- Marketing-Sourced ARR: Quantifies revenue directly driven by marketing.
- Net Revenue Retention (NRR): Measures revenue growth from existing customers.
- Trial-to-Paid Conversion Rate: Tracks free trial users converting to paying customers.
- Win Rate: Percentage of qualified opportunities that close.
These KPIs emphasize revenue accountability, efficiency, and alignment between marketing and sales. Companies using fractional CMOs have seen 29% revenue growth, compared to 19% without. By focusing on metrics that matter, fractional CMOs can transform marketing into a revenue engine.
What Makes a Good KPI for a Fractional CMO?
A strong fractional CMO KPI should help leadership make decisions. It should show whether marketing is improving revenue outcomes, not just increasing activity.
The best KPIs usually do one of three things:
- Connect marketing to pipeline or ARR
- Show whether the acquisition is becoming more efficient
- Reveal whether marketing and sales are aligned around the right customers
That is why the strongest fractional CMO scorecards usually include a small set of revenue, pipeline, conversion, and retention metrics instead of dozens of disconnected marketing reports.
10 Revenue-Focused KPIs for Fractional CMOs in 2026
10 KPIs Fractional CMOs Should Track
sbb-itb-8f8c601
1. Net New ARR
Net New ARR measures the new recurring revenue added in a specific period. It’s calculated as (New ARR + Expansion ARR) – Churned ARR. Unlike activity-based metrics, it focuses solely on revenue impact, making it a key accountability measure for B2B fractional CMOs. It’s the ultimate test: is marketing driving real business growth, or just creating buzz?
Revenue Alignment with Business Goals
This metric pushes those who hire a fractional CMO to adopt a business-first mindset, moving away from vanity metrics like impressions or clicks. Instead, the focus is on real revenue growth. By prioritizing Net New ARR, every decision – from fine-tuning your Ideal Customer Profile to reallocating marketing budgets – becomes directly tied to generating closed-won revenue.
Mark Gabrielli, Founder of MarkCMO, sums it up perfectly:
“It doesn’t matter how much pipeline marketing creates if none of it closes. Track marketing’s influence on actual closed-won revenue – not just pipeline creation.”
Efficiency in Customer Acquisition and Retention
Net New ARR doesn’t just track new acquisitions; it also accounts for retention, ensuring you’re not masking poor performance with low-quality leads. A well-executed program should influence 40–60% of closed-won revenue within 6–12 months. If results fall below this range, it may signal issues such as targeting the wrong audience or misalignment between marketing and sales efforts.
Effectiveness of Marketing-Sales Alignment
This metric thrives when marketing and sales are fully aligned, sharing the same revenue-driven objectives. By tracking revenue instead of just pipeline opportunities, both teams are held accountable for delivering deals that not only close but also stick. Net New ARR sets the stage for other metrics, all of which aim to translate marketing activities into tangible revenue outcomes.
2. CAC Payback Period
The CAC Payback Period measures how many months it takes to recover the cost of acquiring a customer. It’s a key metric for gauging efficiency, and fractional CMOs often take ownership of it to demonstrate marketing ROI to the CEO and the board.
Efficiency in Customer Acquisition and Retention
This metric highlights underperforming channels, enabling companies to reallocate resources to those with higher returns. In the world of B2B SaaS, it works hand in hand with Net Revenue Retention (NRR) to ensure that businesses attract customers who not only stay but also quickly offset their acquisition costs.
Mark Gabrielli, Founder of MarkCMO, puts it this way:
“Customer Acquisition Cost payback period tells you whether the business can sustainably afford its growth rate.”
By focusing on reducing inefficiencies, companies can improve their profitability over time.
Impact on Long-Term Profitability
With marketing budgets projected to hover around 7.7% of revenue by 2026, every dollar spent needs to yield quick returns. A strong fractional CMO strategy aims to reduce the CAC Payback Period to 12 months or less – significantly better than the 18–30 months typical for early-stage companies. Businesses leveraging fractional CMO agencies have seen an average revenue growth of 29%, compared to just 19% for those without this leadership. Shortening the payback period not only boosts profitability but also supports broader growth plans.
Effectiveness of Marketing-Sales Alignment
Aligning marketing and sales is another critical factor in speeding up the payback period. Even with a strong top-of-funnel, poor coordination between marketing and sales can lead to low sales-accepted lead rates, which drags out the payback timeline. Fractional CMOs tackle this by refining the Ideal Customer Profile, ensuring sales teams focus on leads that deliver faster, more reliable returns. This alignment plays a big role in maximizing efficiency and driving sustainable growth.
3. Return on Marketing Investment (ROMI)
ROMI measures how effectively marketing spend translates into revenue. Like Net New ARR and CAC Payback, ROMI prioritizes revenue-linked metrics over activity-based ones. In 2026, fractional CMOs are increasingly moving away from vanity metrics like clicks and impressions. Instead, they focus on tracking how each dollar spent affects closed-won deals and pipeline growth. This shift ensures marketing efforts align closely with business outcomes, refining acquisition strategies and strengthening collaboration between sales and marketing.
Revenue Alignment with Business Goals
Top fractional CMOs start strong by establishing a baseline in their first week. They analyze 12 months of CRM data to determine what percentage of deals are influenced by marketing efforts. This initial step lays the groundwork for tracking progress. Without this baseline and mutually agreed-upon metrics, fractional CMOs risk facing disputes about results by the six-month mark, with no objective data to back their performance.
By the end of the first 90 days, successful engagements should yield a pipeline coverage ratio of 3–4× quota. This ensures that marketing is generating meaningful opportunities for the sales team to convert.
Efficiency in Customer Acquisition and Retention
ROMI helps identify which marketing channels deliver strong returns and which fall short. Within the first two weeks, fractional CMOs conduct a marketing channel audit, cutting spending on channels that do not contribute to the pipeline. The freed-up budget is redirected to high-performing channels.
For B2B SaaS companies, the impact of fractional CMOs is clear: businesses with fractional CMOs experienced an average revenue growth of 29%, compared to 19% for those without – a 10-point advantage. Some initiatives have even led to a 77% reduction in paid acquisition costs while simultaneously driving revenue growth.
Effectiveness of Marketing-Sales Alignment
ROMI improves dramatically when marketing and sales operate in sync. Key metrics like Sales Acceptance Rates and Marketing-Sourced Pipeline Value gauge this alignment. Success is evident when sales teams attribute shorter sales cycles or better handling of late-stage objections to marketing content.
Given the lengthy B2B sales cycles, typically spanning 6–18 months, ROMI should be monitored using leading indicators such as pipeline velocity, outbound reply rates (aiming for over 3%), and demo-to-opportunity conversion rates. These early metrics provide insight before revenue is fully realized. This approach reinforces the overarching focus on business-driven results across all KPIs.
4. LTV: CAC Ratio
The LTV:CAC ratio assesses whether a customer’s lifetime value justifies the cost of acquiring them. For SaaS fractional CMOs, this metric is a key indicator of whether the revenue engine is on a sustainable path. A healthy ratio of 3:1 or higher means each customer brings in at least three times the acquisition cost. A lower ratio signals potential issues – either acquisition costs are too steep, or customers are leaving before delivering enough value. This metric is central to the data-driven strategies fractional CMOs use to guide marketing decisions toward long-term growth.
Strategic Ownership of Unit Economics
Fractional CMOs treat the LTV:CAC ratio as a crucial barometer of the revenue engine’s overall health. They use this metric to build systems that translate marketing insights into product improvements and refine messaging to enhance customer retention. As Peter Geisheker, CEO of The Geisheker Group, explains:
“A fractional marketing executive in B2B SaaS owns CAC payback period, LTV-to-CAC ratio, NRR, logo churn, expansion revenue contribution, MQL-to-SQL conversion rate, and pipeline contribution to ARR.”
This approach shifts focus away from vanity metrics, like the sheer number of leads—often the focus of a lead generation agency vs. fractional CMO—and emphasizes generating leads that align with the Ideal Customer Profile.
Efficiency in Customer Acquisition and Retention
Improving the LTV:CAC ratio requires disciplined efforts across both acquisition and retention. On the CAC side, fractional CMOs eliminate low-performing channels that inflate costs without delivering quality leads.
Instead, they prioritize high-performing channels that yield better results. On the LTV side, they focus on lifecycle marketing, expanding the pipeline, and implementing strategies that encourage product adoption, increasing the value customers bring over time. Companies with fractional CMOs have seen average revenue growth of 29%, compared to 19% for those without such leadership. In some cases, these efforts have led to a 77% reduction in paid acquisition costs.
Impact on Long-Term Profitability
The LTV:CAC ratio isn’t just about short-term efficiency – it’s a window into the company’s long-term financial health. For businesses preparing for a capital raise or exit, this metric provides compelling evidence of sustainable growth.
Fractional CMOs use it to demonstrate measurable EBITDA contributions to boards and investors, showing that marketing efforts are building a scalable business model. As Yuliia Shvetsova from O-CMO puts it:
“The real lift often happens before the lead hits your CRM. When strategy tightens and awareness deepens, growth becomes scalable – and that’s the metric that counts.”
Effectiveness of Marketing-Sales Alignment
The LTV:CAC ratio also underscores the importance of collaboration between marketing and sales. For the ratio to work, both teams must coordinate across the customer journey. Marketing needs to deliver high-quality leads that sales can close effectively, and those customers must stay long enough to justify the acquisition costs. SaaS companies with tightly aligned marketing and sales functions achieve 15–20% higher revenue growth than those operating in silos. Additionally, this metric forces teams to align on what constitutes a “sales-ready” lead, reducing friction from misaligned expectations. By focusing on this ratio, businesses can identify and address gaps in lead quality or sales conversions, ensuring both teams work toward shared growth goals.
5. Pipeline Velocity
Pipeline velocity tracks how quickly prospects move through your sales funnel, focusing on the number of new qualified opportunities created in the last 30 days. For fractional CMOs, this metric offers an early glimpse into whether a marketing strategy is delivering results, even before revenue is officially closed. Instead of just counting leads, pipeline velocity prioritizes sales-ready demand that directly drives revenue growth.
Revenue Alignment with Business Goals
Unlike full-time CMOs, who typically have six months to demonstrate results, fractional CMOs are expected to deliver measurable impact within six weeks. Pipeline velocity demonstrates that strategic efforts – such as refining the Ideal Customer Profile or enhancing messaging – are improving execution and driving commercial results. A strong B2B marketing program can influence 40–60% of closed-won revenue within 6–12 months. Yuliia Shvetsova from O-CMO puts it this way:
“You’re not paying for clicks or impressions – you’re investing in a system that creates sales-ready demand. Pipeline tells you if the system is working.”
This rapid movement of prospects through the pipeline not only validates the strategy but also highlights areas where adjustments may be needed, particularly in the marketing-sales handoff.
Effectiveness of Marketing-Sales Alignment
Pipeline velocity also reveals how well marketing and sales are working together. For example, a decline in sales acceptance rates for inbound demos, even as lead volume grows, may signal misalignment and inefficiencies in acquisition efforts. Fractional CMOs often hold weekly pipeline reviews for sales and marketing to pinpoint and address bottlenecks quickly. They also track two key metrics: lead-to-opportunity velocity (which measures top-of-funnel efficiency) and opportunity-to-close velocity (which reflects how well marketing supports the sales team). For industries with long buying cycles, such as healthcare, analyzing the age of opportunities at each stage provides a more detailed view. A downward trend in opportunity age indicates improving efficiency, even before deals are finalized.
Efficiency in Customer Acquisition and Retention
Improving pipeline velocity starts with documenting baseline funnel conversion rates to track progress accurately. Fractional CMOs review funnel-stage content to identify weaknesses and allocate resources to accelerate deal closures. Mark Gabrielli from MarkCMO emphasizes:
“If no marketing-influenced pipeline emerges within two months, re-examine strategy or sales execution.”
The focus should be on leads that align with your Ideal Customer Profile and are likely to convert quickly. High pipeline velocity shortens sales cycles and lays the groundwork for stronger Net Revenue Retention over time. By accelerating the pipeline, companies can improve both their sales efficiency and long-term revenue outcomes.
6. MQL-to-SQL Conversion Rate
This metric ties marketing efforts directly to revenue results. It tracks how many Marketing Qualified Leads (MQLs) transition into Sales Qualified Leads (SQLs) – those that the sales team accepts and actively pursues. On average, just 13% of MQLs convert to SQLs in a typical B2B funnel. For fractional CMOs, this number highlights whether marketing is driving real, sales-ready opportunities. It’s a key measure for evaluating the effectiveness of lead qualification strategies.
Revenue Alignment with Business Goals
The number of leads alone doesn’t guarantee revenue growth. Fractional CMOs shift the focus from “how many leads did we generate?” to “how many of those leads did sales actually accept?” This conversion rate serves as a litmus test: if lead volume increases while sales acceptance declines, the strategy needs rethinking. Yuliia Shvetsova from O-CMO sums it up perfectly:
“In B2B, volume without qualification creates noise, not growth.”
This metric serves as a predictor of strategic success. Fractional CMOs aim to improve these numbers within a tight timeframe – typically six weeks.
Better conversion rates don’t just drive revenue; they also enhance efficiency in acquiring and retaining customers.
Efficiency in Customer Acquisition and Retention
Strong conversion rates indicate that marketing is effectively targeting the Ideal Customer Profile (ICP), enabling the sales team to focus on closing deals. This precision lowers customer acquisition costs (CAC) and shortens sales cycles. As conversion rates improve, fractional CMOs can reallocate budgets to high-performing channels and reduce spending on underperforming ones.
Effectiveness of Marketing-Sales Alignment
The MQL-to-SQL conversion rate is the clearest measure of sales acceptance. It reflects how well marketing’s definition of a qualified lead aligns with what sales actually needs. To maintain this alignment, fractional CMOs implement weekly pipeline reviews where marketing and sales teams discuss progress and refine their shared goals. They also document baseline conversion rates to track and measure improvements objectively.
7. Marketing-Sourced ARR Percentage
Marketing-Sourced ARR Percentage shows how marketing directly contributes to revenue. This metric tracks the share of total closed-won Annual Recurring Revenue (ARR) that comes from marketing-driven efforts. For example, a deal initiated by an inbound demo request counts as marketing-sourced, while one originating from a founder’s personal network – even if it later engages with marketing materials – does not. It links marketing activities to revenue outcomes, demonstrating accountability.
Revenue Alignment with Business Goals
This metric addresses a pressing question for CEOs and boards: Is marketing driving revenue or merely playing a supporting role? Alexander Chua, Co-Founder of Growigami, sums it up:
“Marketing-Sourced Revenue… is the number that tells you whether marketing is a revenue engine or a support function.”
The benchmarks for this metric vary depending on a company’s growth stage. Seed-stage companies ($0-$1M ARR) generally see 30-50% of revenue coming from marketing. For Series A ($1M-$5M ARR), that range increases to 40-60%, and for Series B ($5M+ ARR), it should be 50-70%. A strong B2B marketing program should influence 40-60% of closed-won deals within 6-12 months of bringing in a fractional CMO. Beyond tracking revenue alignment, this KPI can also expose disconnects between marketing and sales teams.
Effectiveness of Marketing-Sales Alignment
When lead volume is high but marketing-sourced ARR remains low, it often signals a breakdown in the sales handoff process. In such cases, marketing might be generating leads, but sales isn’t converting them into revenue. Mark Gabrielli, Founder of MarkCMO, explains it clearly:
“If your team is closing deals exclusively through founder network and outbound sales with no marketing influence, that’s a fixable problem – and it’s exactly the problem a fractional CMO should be fixing.”
To address this, fractional CMOs establish baseline metrics to determine how many deals currently involve marketing touchpoints. They also implement W-shaped attribution models – assigning 30% credit each to the first touch, lead creation, and opportunity creation. This approach avoids over-reliance on last-touch attribution, which often skews credit toward sales or direct traffic, making marketing appear less impactful in B2B SaaS. Improving marketing-sourced ARR not only resolves alignment challenges but also sets the stage for sustainable growth.
Impact on Long-Term Profitability
Boosting marketing-sourced ARR enables businesses to build a scalable demand-generation system, reducing reliance on founder networks and outbound-heavy strategies. Over time, this shift lowers customer acquisition costs by creating a more efficient, automated inbound engine. With marketing budgets expected to hover around 9.1% of company revenue by 2026 – down from 11% before the pandemic – direct revenue attribution becomes even more critical for justifying spending.
8. Net Revenue Retention (NRR)
Net Revenue Retention (NRR) measures how revenue changes within your existing customer base, factoring in upsells, cross-sells, churn, and downgrades. To calculate it, you add upsell and cross-sell revenue to the initial cohort revenue, subtract churn and downgrades, and divide by the initial revenue. If your NRR exceeds 100%, it means your existing customers are spending more over time, even without acquiring new ones. By 2026, fractional CMOs have come to rely on NRR as a critical metric for assessing whether marketing efforts are bringing in the right customers and driving sustainable growth.
Revenue Alignment with Business Goals
NRR shifts the focus from generating leads to ensuring revenue stability and growth. Mark Gabrielli, Founder of MarkCMO, highlights its importance:
by six months, you should see NRR moving above 100% if it was below (driven by improved customer education and expansion plays).
This metric helps fractional CMOs evaluate their Ideal Customer Profile (ICP) strategy. A high NRR signals that marketing is successfully attracting loyal, high-value customers. It also underscores the transition from vanity metrics to revenue-focused accountability, ensuring marketing efforts contribute meaningfully to the business. This focus on retaining and expanding customer revenue lays the groundwork for operational efficiency.
Efficiency in Customer Acquisition and Retention
A low NRR often indicates a mismatch between the target audience and the product or service. Yuliia Shvetsova, a fractional CMO expert, notes:
The real lift often happens before the lead hits your CRM. When strategy tightens and awareness deepens, growth becomes scalable – and that’s the metric that counts.
A high NRR demonstrates that acquisition spending is well-targeted, creating a customer base that grows through expansion revenue. This reduces the reliance on continually acquiring new customers, making growth more sustainable.
Impact on Long-Term Profitability
NRR doesn’t just measure retention—it drives profitability. Expansion revenue typically carries higher margins than acquiring new customers. By focusing on NRR, fractional CMOs can build a self-sustaining revenue engine that scales without requiring proportional increases in marketing budgets. The Geisheker Group emphasizes:
generic marketing KPIs (impressions, clicks, MQLs in isolation) are insufficient at the executive level.
Boards and CEOs value NRR for its ability to showcase efficient, scalable growth. Additionally, the fractional CMO model tends to offer more stability, with average engagement lasting 71 months compared to just 42 months for full-time CMOs.
Effectiveness of Marketing-Sales Alignment
Improving NRR requires seamless collaboration across marketing, sales, and customer success teams. As Strategic Pete’s methodology suggests, NRR serves as a shared accountability metric for driving sustainable revenue growth. This means marketing must deliver actionable insights that influence product development, refine messaging, and enhance customer education. Fractional CMOs take charge of these efforts, ensuring customers not only sign up but also deepen their engagement over time.
9. Trial-to-Paid Conversion Rate
The trial-to-paid conversion rate measures how effectively free trial users become paying customers in Product-Led Growth (PLG) models. For fractional CMOs in 2026, this metric is a key indicator of whether marketing efforts are attracting the right audience – not just generating irrelevant leads.
A high conversion rate indicates a strong product-market fit and suggests that your messaging aligns with your Ideal Customer Profile (ICP). On the other hand, a low conversion rate may point to targeting the wrong audience or failing to showcase the product’s value during the trial period. This metric is essential for ensuring marketing efforts directly support revenue growth, just as other KPIs tie marketing to business outcomes.
Revenue Alignment with Business Goals
Unlike vanity metrics, the trial-to-paid conversion rate reveals whether acquisition strategies are driving revenue. Bruno Ueda, Co-Founder of Growigami, explains:
A fractional CMO is not a contractor. Contractors complete assigned tasks. A fractional CMO decides which tasks matter, builds the roadmap, allocates the budget, and connects marketing activity to business outcomes.
By analyzing conversion rates across different segments, fractional CMOs can focus spending on the most effective channels. This data-driven strategy ensures that every dollar spent on acquiring trial users has a clear path to revenue, rather than just generating activity.
Efficiency in Customer Acquisition and Retention
Improving the trial-to-paid conversion rate enhances the LTV:CAC ratio by maximizing returns on existing marketing investments. For example, a B2B SaaS startup under fractional leadership used CRM-driven lead scoring to increase qualified leads by 35% and lower CAC by 22%. This was achieved by ensuring sales teams concentrated on high-intent trial users. Additionally, users who experience clear value during the trial are more likely to remain loyal, reducing churn and increasing lifetime value.
Effectiveness of Marketing-Sales Alignment
This metric also reflects how well marketing and sales teams work together to convert interest into paying customers. It acts as a bottom-of-funnel indicator of alignment. If marketing attracts the wrong ICP, even the best sales efforts will struggle to convert. Michael Porter, Fractional CMO at Porter Wills, notes:
A fractional CMO acts as a powerful unifying force, aligning both teams around common goals, shared definitions… and integrated KPIs to create a single, seamless revenue engine.
Aligned marketing and sales teams can drive 15–20% higher revenue growth. Fractional CMOs play a crucial role in this by optimizing weekly go-to-market (GTM) meetings to review and refine conversion strategies.
10. Win Rate
Win rate – the percentage of qualified opportunities that turn into paying customers – is a critical metric for understanding how well your marketing efforts are driving revenue. Unlike metrics such as lead volume or MQL counts, win rate clearly shows whether you’re attracting buyers who are a genuine fit. For fractional CMOs in 2026, this metric ties marketing strategy directly to sales execution, ensuring that the go-to-market (GTM) system generates opportunities that sales teams can close successfully.
Revenue Alignment with Business Goals
Win rate shifts the focus from surface-level metrics to metrics that truly impact the bottom line. By monitoring win rates, businesses can assess if their marketing efforts are targeting the right Ideal Customer Profile (ICP) or simply increasing low-quality lead volume. For instance, if lead volume rises but win rates fall, it’s a clear sign to reevaluate channel spending or adjust messaging. Fractional CMOs must set clear rules to ensure that such trends trigger immediate action.
“A scorecard is a decision tool, not a reporting scrapbook. Its job is to help leadership choose what to do next.”
This proactive approach ensures that decision-makers can quickly address issues when discrepancies between lead volume and win rate arise. It also fits seamlessly into the broader KPI framework discussed earlier.
Efficiency in Customer Acquisition and Retention
A high win rate reflects efficient growth, showing that marketing is effectively reducing revenue risk. In B2B marketing – especially with long sales cycles – quality far outweighs quantity.
“A high-performing fractional CMO focuses on pipeline quality, not vanity metrics. That means: SQL-to-close conversion rates, velocity from lead to opportunity, and fit of leads against ICP.”
Tracking win rates not only helps confirm whether the right ICP is being targeted but also enables quick tactical adjustments when lead volume increases but conversions lag. Improving win rate lowers the effective Customer Acquisition Cost (CAC) by increasing the return on each qualified opportunity, enabling sales teams to focus on prospects with genuine potential.
Impact on Long-Term Profitability
Win rate also offers a qualitative measure of how well your messaging resonates with the market. Conducting win/loss audits of closed deals can refine ICP definitions and improve sales-ready messaging frameworks. Senior marketing leaders drive impact first through strategic focus, then through operational improvements – such as boosting win rates and reducing CAC – and ultimately through revenue growth. These insights feed directly into the sustainable revenue strategies highlighted throughout this article.
Effectiveness of Marketing-Sales Alignment
Win rate serves as a shared metric, holding both marketing and sales accountable for revenue outcomes. Weekly sales-marketing pipeline reviews help ensure real-time alignment on lead quality and conversion challenges. By 2026, fractional CMOs are moving away from overly complex scorecards with dozens of tabs, favoring concise ones that spotlight 5–7 key metrics, including win rate and pipeline quality. Tracking win rates for specific segments or priority accounts can also uncover hidden issues that might otherwise go unnoticed. These streamlined scorecards emphasize the importance of actionable, efficiency-driven metrics.
“Fractional CMOs are hired to enhance coherence, accountability, and commercial impact in marketing.”
Core Metrics Fractional CMOs Track in Real-Time
Fractional CMOs need instant access to key data to spot revenue opportunities and make quick decisions about resource allocation. Their focus is on a handful of metrics that tie marketing activities directly to business outcomes. The idea isn’t to track everything – it’s about zeroing in on what matters most to the CEO and revenue teams.
The best fractional CMOs focus on 5–7 critical metrics, avoiding the clutter of excessive reporting, often called “reporting-scrapbook” overload. This streamlined approach keeps their attention on the numbers that drive growth. These metrics generally fall into three categories: business outcomes (such as pipeline created), leading indicators (such as funnel conversion rates), and operating-health metrics (such as CRM data quality). By tracking these in real time, fractional CMOs can adjust strategies on the fly, ensuring campaigns deliver measurable results. Let’s break down these three essential categories.
Marketing-Influenced Pipeline
For B2B and SaaS companies, the marketing-influenced pipeline is the cornerstone metric. This isn’t just about counting leads – it’s about quantifying the revenue potential generated by marketing efforts. Fractional CMOs focus on metrics such as accepted pipeline from target accounts and the growth of marketing-qualified pipeline, rather than relying solely on MQL counts.
This approach shifts the conversation with CEOs from raw lead numbers to actual revenue opportunities. Real-time tracking allows fractional CMOs to identify which campaigns are driving revenue and which ones need adjustment, keeping the focus on high-impact initiatives.
Lead Quality and Conversion Rates
A key priority for fractional CMOs is tracking lead quality and conversion rates, particularly metrics such as qualified lead-to-opportunity rates and inbound demo sales-acceptance rates. These metrics help ensure that leads align with the ideal customer profile (ICP).
By monitoring these metrics in real time, fractional CMOs can pinpoint funnel weaknesses. For instance, if a campaign generates a high volume of leads but low sales acceptance, it’s a clear signal to pause and reevaluate. Data shows that lead quality scores typically improve by 45% within six months of engaging a fractional CMO, while lead-to-customer conversion rates often increase by 30–50% due to enhanced qualification processes. Micro-conversions, such as landing page bounce rates and session durations, also provide early insights into messaging effectiveness.
Customer Acquisition Cost (CAC) by Channel
Tracking CAC by channel in real time helps fractional CMOs identify underperforming strategies and reallocate budgets promptly. This ensures that low overall costs don’t mask issues with lead quality. Monitoring payback periods is another critical step to ensure marketing spend remains sustainable.
Here’s how these metrics break down:
| Metric Category | Specific KPIs to Track | Purpose |
|---|---|---|
| Business Outcomes | Pipeline created ($), Blended CAC, Payback period | Measures bottom-line business impact |
| Leading Indicators | Sales-acceptance rate, Funnel conversion, Demo quality | Predicts future revenue and validates strategy |
| Operating-Health | CRM hygiene, Reporting cadence, Decision velocity | Measures the durability and efficiency of the marketing system |
Campaign Performance Metrics to Track in Real-Time
Business outcome metrics tell you where you end up, but execution-level metrics reveal what’s happening right now. These real-time indicators allow you to make quick adjustments before the week is over. Fractional CMOs rely on these metrics to address problems early and amplify successful strategies, often reacting within hours instead of days.
Engagement Metrics
Email open rates and click-through rates are key for spotting issues that need immediate attention. In B2B campaigns, email open rates typically fall between 15–30%, while click-through rates hover around 3–5% as healthy benchmarks. If these numbers dip below expectations, it’s time to act fast – experiment with new subject lines, adjust send times, or refine audience segmentation. These engagement stats provide a critical early signal, helping you fine-tune campaigns before diving into a deeper channel-by-channel analysis.
Channel-Specific Performance
Tracking metrics like customer acquisition cost (CAC) and conversion rates for each channel helps fractional CMOs quickly shift budgets. Whether it’s LinkedIn ads, Google Search, content syndication, or webinars, the goal is to identify high-performing channels and cut underperforming ones. The focus is on investing in high-intent channels that align with the ideal customer profile while eliminating wasted spend.
To make this process seamless, standardized tracking – using consistent UTM parameters and naming conventions – is essential. This eliminates the need for manual cleanup, making it easier to compare channel performance and reallocate resources effectively.
Infrastructure Needed for Real-Time Tracking
Fractional vs Full-Time CMO: Speed of Impact Comparison
To make real-time tracking work, you need a well-designed system that connects data sources, cleans up information, and delivers insights quickly. This infrastructure is the backbone of real-time campaign tracking, allowing fractional CMOs to tweak strategies on the fly to boost revenue. Without it, even the best metrics lose their value if they arrive late or conflict across departments.
Dashboard Setup and CRM Data Quality
Everything starts with clean data. CRM data accuracy tends to drop by about 2.1% every month, and only 11% of RevOps teams report having high-quality data. This makes automated checks essential for spotting and fixing inaccuracies before they mess up your reporting – manual efforts just won’t cut it for real-time needs.
To avoid confusion, use tools like dbt or LookML to build a semantic layer. This ensures consistent metric definitions across teams. Without this shared framework, marketing and sales could report different numbers for the same campaign, creating more questions than answers. Modern systems often integrate AI-driven analytics platforms that work with your existing data warehouse and CRM. These platforms let users ask natural-language questions, like in Slack, and receive immediate, accurate answers.
When setting up dashboards, focus on 5–7 key metrics that cover three areas:
- Business outcomes (e.g., pipeline created)
- Leading indicators (e.g., conversion rates)
- Operational health (e.g., reporting cadence)
Include a “Risks and Asks” section in your scorecards to highlight potential challenges and outline what resources or decisions are needed from leadership. This kind of setup ensures your team can act on insights without delay.
Decision Speed
Once you have reliable dashboards and clean data, the next step is acting fast. The infrastructure should support moving from insight to action within 24–48 hours. Companies using real-time analytics report decisions that are 34% faster than those relying on traditional reporting cycles, which leads to a 28% boost in campaign performance. Fractional CMOs, in particular, need the authority to make budget and strategy changes within this narrow window to keep campaigns on track.
“Delayed pipeline data is a competitive liability; real-time measurement lets CMOs act while there is still time to influence the outcome.” – Luca Martial, CEO, Kaelio
Automated alerts via Slack or Teams can flag critical changes – like a pipeline dip or a major deal moving stages – so teams can respond immediately. This ensures decisions happen within the crucial 24–48-hour timeframe.
Fractional vs. Full-Time CMOs: Speed of Impact
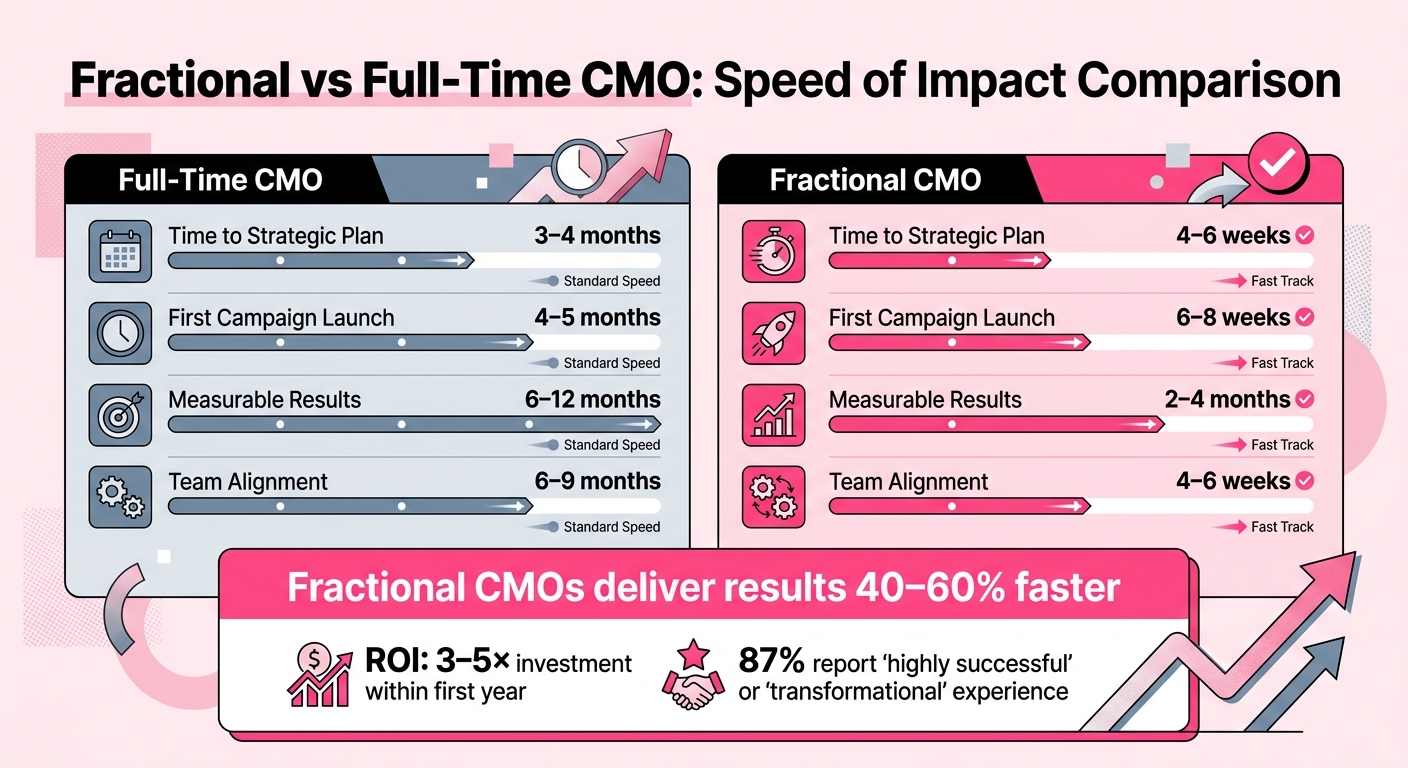
While the infrastructure requirements for real-time tracking are the same, the timelines for results differ between fractional and full-time CMOs. A full-time CMO usually takes 3–4 months to create a strategy and 6–12 months to show measurable results. Fractional CMOs, however, operate on a much tighter schedule, delivering a strategic plan in 4–6 weeks and measurable outcomes in just 2–4 months.
| Metric | Full-Time CMO | Fractional CMO |
|---|---|---|
| Time to strategic plan | 3–4 months | 4–6 weeks |
| First campaign launch | 4–5 months | 6–8 weeks |
| Measurable results | 6–12 months | 2–4 months |
| Team alignment | 6–9 months | 4–6 weeks |
This faster pace means fractional CMOs deliver results 40–60% quicker. They don’t have the luxury of “figuring things out” over several months – the infrastructure must be ready to go from day one. Companies that hire fractional CMOs often see an ROI of 3–5x their investment within the first year, with 87% calling the experience “highly successful” or “transformational”.
Common Budget Allocation Problems
Many companies face three major challenges when it comes to allocating their marketing budgets. These issues not only waste resources but also create tension between departments and make it hard to demonstrate marketing’s value to leadership.
Poor Distribution Across Marketing Channels
One of the biggest pitfalls is allocating budgets based on intuition rather than performance data. This often results in money being funneled into underperforming channels while high-potential ones are left underfunded. In fact, about 40% of marketing budgets can end up wasted on channels that generate clicks but fail to contribute to the pipeline due to poor attribution tracking.
Another common mistake is an uneven investment across the different stages of the funnel. Many companies pour resources into top-of-funnel awareness campaigns or bottom-of-funnel conversion tactics but overlook the middle of the funnel – the consideration stage – which should receive 30–40% of the budget. This neglect creates a disjointed customer journey, where leads enter the funnel but fail to move toward a purchase. For instance, email marketing delivers an average return of $42 for every $1 spent, yet it often gets underfunded because its impact is hard to measure accurately. This imbalance encourages decision-making based on gut feelings rather than data-driven insights.
Decisions Based on Guesswork Instead of Data
A lack of collaboration between marketing and finance often forces decisions to be made on guesswork rather than evidence. While 83% of marketers say measuring ROI is a top priority, only 36% are able to do so effectively across all activities. Additionally, just 35% of marketing leaders report strong collaboration with finance teams. Without a shared data framework, marketing is often seen as a cost center instead of a growth driver, making it harder to justify spending or reallocate resources to high-performing channels.
"Marketing budget allocation is where strategy meets reality, separating companies that grow efficiently from those that burn cash with little to show for it." – Max Beauroyre, Head of Growth at Abacum
This disconnect is so impactful that every single CMO agrees poor collaboration with finance undermines their ability to meet revenue targets. Establishing a unified data strategy can replace guesswork with informed decisions, a key principle of fractional CMO approaches. Until then, guesswork will continue to cloud ROI tracking and resource allocation.
Problems Measuring ROI Accurately
Disconnected systems and siloed data make tracking ROI a major challenge. When CRMs and marketing platforms don’t integrate, leads can fall through the cracks, and the full customer journey becomes impossible to map. This often results in "untracked spending", where companies invest heavily in paid media but fail to connect that spend to actual closed deals.
"I’m spending money on marketing but I can’t tell you what it’s producing. That’s not a marketing problem. It’s a leadership vacuum." This leadership gap is often why companies hire a fractional CMO to bridge the divide between marketing spend and revenue. – Lou Hughes, CEO, Moving Minds
Without clearly defined Ideal Customer Profiles (ICPs) and robust tracking systems, businesses risk throwing money at channels that generate activity but no real revenue. This creates a cycle where marketing teams confuse running campaigns ("motion") with driving actual results ("momentum"). Addressing these issues with data-driven frameworks can not only improve ROI measurement but also ensure budgets are allocated more effectively.
How Fractional CMOs Use Data to Allocate Budgets
Fractional CMOs take a fresh approach to deciding where marketing dollars go. They begin by conducting a thorough audit to identify what’s actually delivering results. This detailed analysis helps them move away from scattered marketing efforts and toward a structured system where every dollar spent ties back to measurable revenue. The result? A clear connection between analysis and actionable budget adjustments.
Moving from Intuition to Data-Based Decisions
Once the audit is complete, fractional CMOs shift from relying on gut feelings to focusing on measurable outcomes. They prioritize outcome-based metrics – like lead quality, pipeline progression, and deal velocity – over traditional activity metrics such as clicks or impressions. Part of this shift involves identifying inefficiencies, such as silent churn, where leads enter the funnel but vanish before converting.
To ensure funds are allocated effectively, fractional CMOs use tools like a RACI matrix to define roles and responsibilities, while setting service-level agreements (SLAs) between marketing and sales. They also streamline the marketing tech stack, cutting out redundant tools and redirecting those savings toward channels that reliably drive qualified leads. On the sales side of that agreement, the counterpart is often a fractional sales leader.
Core Metrics for Budget Decisions
Rather than focusing on cost-per-click, fractional CMOs optimize spending based on metrics like customer acquisition cost (CAC), lifetime value (LTV), return on investment (ROI), and funnel conversion rates. They also keep an eye on churn rates to improve retention. For example, one tech startup that adopted this data-driven strategy saw a 150% increase in lead generation and a 200% jump in sales within just six months.
Continuous Monitoring and Real-Time Budget Adjustments
Fractional CMOs don’t stop at setting the budget – they continuously monitor performance to refine their strategy. Weekly KPI reviews and "funnel delta" meetings help them identify where prospects are dropping off. From there, they reallocate funds from underperforming ads to channels that are driving better results.
To strike a balance between consistency and experimentation, they follow the 70/20/10 rule: allocate 70% of the budget to proven channels, 20% to scalable opportunities, and 10% to experimental initiatives. If an experiment proves successful, it moves into the 20% bucket for scaling and, eventually, into the 70% core allocation. This method ensures most of the budget remains stable while leaving room to test and adopt emerging trends ahead of competitors.
Tools and Methods for Data-Driven Budget Planning
Fractional CMOs rely on tools that integrate marketing, revenue, and financial data into a single, unified system. This approach eliminates the hassle of managing separate spreadsheets and reports, enabling more precise and agile budget allocation.
Analytics and Attribution Platforms
Platforms like Google Analytics and HubSpot are essential for tracking how prospects move through the sales funnel and identifying which marketing channels drive results. Fractional CMOs for startups often start by auditing their MarTech stack to locate inefficiencies, such as lead leaks. This process can improve attribution accuracy by 70–80%, uncovering that 30–40% of budgets allocated to so-called high-performing channels may actually be misdirected when multi-touch attribution modeling is applied.
The focus here shifts from vanity metrics – like clicks and impressions – to more meaningful indicators such as Customer Acquisition Cost (CAC), Lifetime Value (LTV), and marketing-sourced pipeline. Companies adopting this approach often see a 25–35% reduction in customer acquisition costs within just a few months. These insights not only enhance decision-making but also enable automated adjustments and more effective scenario planning.
Marketing Automation Software
Tools like HubSpot, Marketo, and Salesforce Marketing Cloud bring together data from CRM systems, ad platforms, and analytics tools. This consolidation allows for continuous optimization and real-time budget reallocation. These platforms are particularly useful for addressing "budget lock-in", which occurs when funds continue to flow to historically successful channels despite diminishing returns.
Before implementing automated budget decisions, fractional CMOs validate the insights to ensure alignment with existing strategies. Once trust is established, these platforms enable scenario modeling, allowing CMOs to test the impact of shifts in channel mix or spending levels on pipeline and revenue before making financial commitments. These automated insights also enhance forecasting, leading to more precise spending adjustments.
Budget Forecasting and Scenario Modeling
Fractional CMOs leverage techniques like zero-based budgeting and response curve modeling to ensure every dollar is allocated effectively. Instead of relying on past spending patterns, they examine historical data to identify when each channel hits its point of diminishing returns. AI-powered budget planning tools can increase ROI by 25–40% and improve forecast accuracy by 15–25% in just 90 days.
To prepare for market fluctuations, fractional CMOs create multiple budget scenarios – downside, baseline, and upside. This proactive planning minimizes the need for reactive cuts when conditions change. As the AI-Ready CMO Editorial Team explains:
"Static annual budgets are obsolete in a world where market conditions shift weekly".
Additionally, tiered approval workflows keep budgets flexible while maintaining control. For example, changes under 5% might be automated, adjustments between 5–15% may require manager approval, and anything over 15% could need the CMO’s sign-off. This layered approach ensures adaptability without compromising oversight.
Need Help Choosing and Tracking the Right Fractional CMO KPIs?
Strategic Pete helps B2B and SaaS companies turn marketing performance into a clear revenue scorecard. Instead of tracking disconnected marketing activity, the process focuses on the KPIs that show whether marketing is improving pipeline quality, CAC efficiency, conversion rates, retention, and ARR growth.
The engagement begins with a 90-day assessment to establish baseline metrics, identify weak points in the funnel, and define which KPIs leadership should review weekly, monthly, and quarterly. From there, Strategic Pete helps teams improve the systems behind those metrics, including positioning, acquisition channels, sales handoff, activation, and expansion.
For companies that need senior marketing leadership without hiring a full-time CMO, this creates a practical way to measure progress and make better growth decisions.
Conclusion
These 10 KPIs highlight the shift from seeing marketing as just a cost to recognizing it as a driver of revenue. For fractional CMOs in 2026, tracking the right metrics isn’t about creating endless dashboards – it’s about making smarter, faster decisions that directly impact revenue. Companies leveraging fractional marketing leadership have seen average revenue growth of 29%, compared to 19% for those without it.
The focus has moved from tracking activities to measuring revenue impact. Metrics need to reflect performance and outcomes, not just serve as checklists. Fractional CMOs are expected to create measurable results quickly – within six weeks – and deliver significant revenue impact in 90 to 180 days. This tight timeline makes data-driven decisions a necessity, not a luxury.
To achieve these results, a structured approach is key. A three-layer framework – Business Outcomes, Leading Indicators, and Operating-Health metrics – ensures you’re not just looking at past performance but also anticipating future challenges and building systems that last. Start by documenting baselines in the first two weeks, narrow your focus to 5–7 essential metrics, and review performance monthly while making quarterly adjustments. With this approach, senior marketing leadership can drive strategic focus, operational improvements, and revenue growth.
The fractional executive model is projected to grow by 14% annually in 2026, offering companies strategic clarity without the expense of full-time overhead. Whether you’re tracking CAC Payback Period, Pipeline Velocity, or Net Revenue Retention, the goal remains the same: turning marketing investments into predictable, scalable revenue growth. Companies thriving today prioritize pipeline quality, conversion speed, and customer lifetime value – hallmarks of effective marketing in this new era.
FAQs
What KPIs should a fractional CMO be responsible for?
A fractional CMO should usually be responsible for KPIs that connect marketing strategy to business outcomes. These often include marketing-sourced pipeline, marketing-sourced ARR, CAC payback period, LTV:CAC ratio, MQL-to-SQL conversion rate, pipeline velocity, win rate, and retention-related metrics such as NRR.
The exact KPI set depends on the company’s stage, sales cycle, and growth model. A startup may focus more on pipeline creation and CAC efficiency, while a scaling SaaS company may place more weight on ARR, retention, and expansion metrics.
Which 5–7 KPIs should I prioritize first?
When setting key performance indicators (KPIs), aim for a mix that reflects business outcomes, early indicators, and the overall health of your operations. Focus on metrics that highlight a fractional CMO’s role in driving revenue growth and aligning strategy. These might include:
- Strategic Progress: How well marketing initiatives align with and advance the company’s long-term goals.
- Pipeline Quality: The strength and potential of leads moving through the sales funnel.
- Marketing Impact: The measurable contribution of marketing efforts to revenue and growth.
By focusing on these metrics, you ensure your work directly aligns with the broader objectives of the business.
How do I set baselines in the first two weeks?
In the initial two weeks, it’s crucial to establish measurable baselines that align with your business objectives. Start by identifying:
- 1-2 core outcomes directly tied to your goals.
- 2-3 leading indicators that signal progress toward those outcomes.
- 1-2 operational health measures to monitor the overall stability of your efforts.
Next, dive into your current data. Use it to set clear expectations for the next 30, 60, and 90 days. Keep track of this progress with a straightforward summary. This approach ensures your baselines are not just theoretical but actionable and directly connected to the challenges the fractional CMO was brought in to address.
What attribution model should I use for marketing-sourced ARR?
An attribution model for marketing-sourced ARR needs to clearly show how marketing efforts contribute to revenue. While there isn’t a one-size-fits-all model, it’s important to set clear baseline metrics that align with your ROI objectives. Prioritize tracking KPIs that demonstrate marketing’s role in driving revenue, and use these metrics to measure and assess its overall impact.
How do you measure fractional CMO performance?
Measure fractional CMO performance by looking at whether marketing is improving revenue-related outcomes, not just producing more campaigns. The most useful signs of performance include stronger pipeline quality, faster lead-to-opportunity conversion, shorter CAC payback, higher marketing-sourced ARR, better win rates, and clearer sales-marketing alignment.
A fractional CMO should also establish baselines early, so leadership can compare progress over the first 30, 60, and 90 days.