
Want to prove your marketing efforts drive revenue? A Marketing ROI calculator is the tool you need to connect your marketing spend to tangible business results. It helps you measure what works, allocate budgets smarter, and showcase the impact to your leadership team.
Want to run the numbers rather than read about them? The marketing ROI calculator is free and on the page — ROI, ROAS, SEO ROI, LTV, CAC, budget and CPM, with no download and no email gate.
- Key Metrics to Track:
- Customer Acquisition Cost (CAC): Total cost to acquire one customer, including marketing and sales expenses.
- Customer Lifetime Value (LTV): Total revenue a customer generates over their relationship with your company.
- Marketing Spend ROI: Measures the return on marketing investments, calculated as
(Revenue - Investment) / Investment × 100.
- Why It Matters:
- Companies with advanced ROI tracking see 40% higher growth rates and 50% lower acquisition costs.
- A strong LTV:CAC ratio (3:1 or higher) signals healthy, sustainable growth.
- Proper tracking turns marketing into a revenue generator, not just a cost.
- Steps to Build Your ROI Calculator:
- Connect Leads to Revenue: Use CRM and analytics tools to track customer journeys from lead to sale.
- Assign Program Costs: Include ad spend, salaries, tools, and overhead for accurate ROI figures.
- Apply Revenue Formulas: Use tailored formulas for revenue, pipeline, and channel-specific ROI.
Track Marketing ROI and Cost per Acquisition in Excel or Google Sheets (No Fancy Software Needed)
sbb-itb-8f8c601
Core Metrics for Your Marketing ROI Calculator
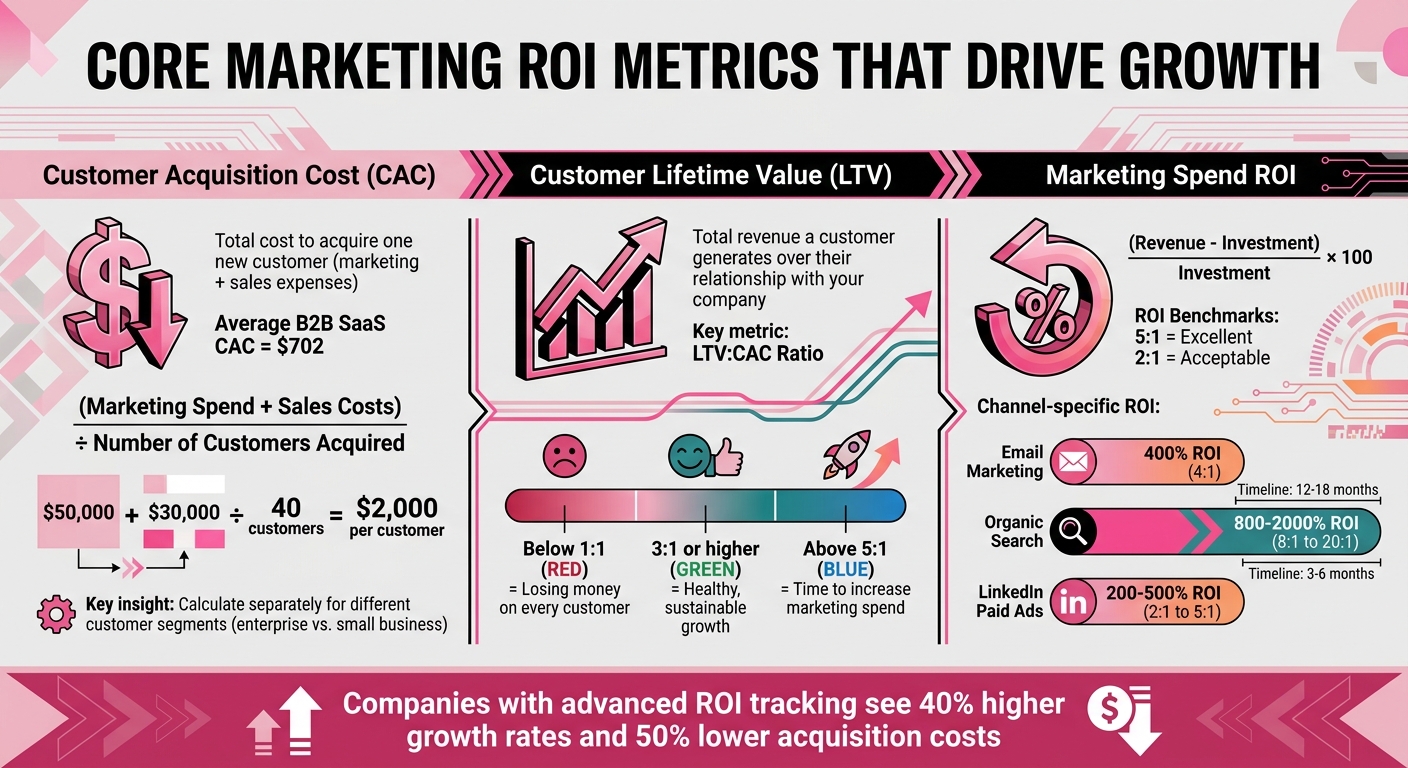
Marketing ROI Key Metrics: CAC, LTV, and ROI Benchmarks
Your ROI calculator is only as reliable as the data you put into it. The three most critical numbers are Customer Acquisition Cost (CAC), Customer Lifetime Value (LTV), and Marketing Spend ROI. These metrics work together to reveal whether your marketing efforts are driving sustainable growth or just draining resources. Let’s dive into what each metric means and how it uncovers real business value.
"CAC is the single most important marketing metric for executive and board conversations. It connects marketing spend to business economics in a way that anyone can evaluate." – MarkCMO
Customer Acquisition Cost (CAC)
CAC tells you how much it costs to bring in one new customer. This isn’t just about ad spend – it includes everything: marketing expenses, sales team salaries, commissions, software tools, and overhead. For context, the average B2B SaaS company spends about $702 per customer. However, these costs can vary widely based on your target audience and marketing channels.
One common mistake is focusing only on marketing spend. A complete CAC calculation should also factor in sales costs. For example, if you spend $50,000 on marketing and $30,000 on sales in a month and acquire 40 customers, your CAC is $2,000 per customer – not $1,250.
It’s also wise to calculate CAC separately for different customer segments. Enterprise clients and small businesses have very different sales cycles and deal sizes. Combining these groups into one CAC figure can mask whether you’re overspending on low-value customers or neglecting higher-value opportunities.
Customer Lifetime Value (LTV)
LTV measures the total revenue a customer brings in over their relationship with your company, minus the costs of serving them. For businesses with recurring revenue models, like SaaS, LTV shifts the focus from short-term gains to long-term value.
This metric helps prevent underinvestment in channels that attract loyal, high-value customers. For instance, a customer who signs a $10,000 annual contract, renews for five years, and eventually expands to $25,000 is far more valuable than one who churns after the first year – even if both cost the same to acquire.
The LTV:CAC ratio is a key indicator of growth potential. A ratio of 3:1 or higher signals healthy growth, while a ratio below 1:1 means you’re losing money on every customer. If your ratio exceeds 5:1, it may be time to increase your marketing spend in those high-performing channels. This ratio provides a clear direction for allocating resources to ensure sustainable growth.
Marketing Spend ROI
The formula for this metric is straightforward: (Revenue Attributable to Marketing – Investment) / Investment × 100. A 5:1 ROI is considered excellent, while 2:1 is generally acceptable.
Different marketing channels yield different returns. For example, email marketing often delivers a 400% ROI for B2B SaaS companies. Organic search can produce returns between 8:1 and 20:1, though it may take 12–18 months to see results. On the other hand, LinkedIn paid ads typically yield 2:1 to 5:1 returns but show results in just 3–6 months.
Timing is everything when measuring ROI. If your sales cycle averages six months, evaluating campaigns on a monthly basis could make them appear ineffective. Instead, use rolling 12-month windows to allow campaigns enough time to demonstrate their full impact.
Next, we’ll explore how to incorporate these metrics into a functional ROI calculator framework.
How to Build Your Marketing ROI Calculator
Creating a marketing ROI calculator means connecting the dots between leads, costs, and revenue. The tricky part? These data streams often exist in separate systems. Here’s how you can bring them together.
Step 1: Connect Leads to Revenue
To track a customer’s journey from their first interaction to purchase, your CRM, ad platforms, and billing system must work together. A unique identifier – like an email address or customer ID – can link these systems seamlessly.
The average customer journey involves 8 to 12 touchpoints before making a purchase. In B2B, this process can take 3 to 18 months and involve 6 to 10 decision-makers. Person-based tracking helps tie anonymous website visits to known contacts in your CRM, ensuring that early interactions are credited when deals close.
For example, ASUS tackled this by consolidating its global marketing data into a BigQuery instance using Improvado. This setup allowed them to generate reports in minutes, saving 90 hours per week. If you’re working with a smaller budget, start with basic attribution: track both first-touch (what drives awareness) and last-touch (what closes deals).
Tag every link with consistent UTM parameters (e.g., source, medium, campaign, content) to track your spending accurately. Also, ask customers "How did you hear about us?" in forms or sales calls to capture offline influences that analytics tools might miss.
Once you’ve connected your data, it’s time to calculate the full cost of your marketing efforts.
Step 2: Assign Program Costs
Many marketers only account for ad spend, which can lead to inflated ROI figures and poor decision-making. To get an accurate picture, you need to include all associated costs: marketing team salaries, software subscriptions, agency fees, and creative development. For instance, if you spend $10,000 on LinkedIn ads, plus $3,000 on agency fees and $2,000 on design work, your total cost is $15,000 – not just the ad spend.
"A classic mistake I see is calculating CAC using only ad spend. For a true picture, you must include all associated costs – marketing team salaries, software subscriptions, agency fees, you name it." – The Data Driven Marketer
Break down these expenses by channel (e.g., paid search, email, social) and campaign. This level of detail can highlight performance differences between channels, helping you allocate your budget more effectively. Timing is important too. For example, a blog post published in January might not lead to a sale until May. Your analysis needs to account for these delays, especially in enterprise sales cycles where the gap between spending and revenue can stretch 6 to 12 months. Cohort-based analysis is useful here: track marketing spend during a specific period and measure the revenue generated from those leads over the following 6 to 18 months.
With costs and data aligned, the next step is to calculate the revenue impact.
Step 3: Apply Revenue and Pipeline Formulas
Once your data and costs are organized, you’ll need formulas tailored to your business model. For closed deals, the basic ROI formula works well: (Revenue – Cost) / Cost × 100. In B2B, where deals take longer to close, pipeline-based formulas can be helpful. These value open opportunities based on their stage and likelihood of closing.
For example, a mid-market MarTech company using Marqeu discovered that content marketing was driving $5.9M in revenue instead of the $800K they initially reported, increasing their marketing ROI from 3.3:1 to 7.1:1 in just one year.
Different channels require different measurement windows. Email marketing often delivers quick results, so a 30-day window might suffice. On the other hand, SEO and content marketing need 9 to 18 months to show their full impact. Measuring all channels on the same timeline could undervalue long-term strategies like content marketing.
Finally, don’t forget to exclude baseline growth trends to isolate the revenue directly tied to your marketing efforts. For instance, if your sales were already growing 10% per quarter before launching a campaign, you can’t attribute all subsequent growth to the campaign. By following this structured approach, you can turn complex data into actionable insights that showcase the true value of your marketing efforts.
ROI Formulas You Need to Know
When it comes to measuring marketing performance, using the right ROI formula at the right time is key. Whether you’re presenting to the board, making budget decisions, or fine-tuning channel spending, these formulas help you stay on top of your game. Below are three formulas tailored to different stages and channels.
Revenue‑Based ROI Formula
The revenue ROI formula is straightforward: (Revenue – Cost) / Cost × 100. For instance, if you spend $15,000 and generate $90,000 in sales, your ROI is 500% (or 5:1). That’s a solid performance. Ratios above 10:1 are rare and usually come from mature channels like organic search or email marketing.
But not all revenue translates to profit. To dig deeper, use the Gross Profit ROI formula: (Gross Profit – Marketing Cost) / Marketing Cost × 100. Let’s say those $90,000 in sales cost $30,000 to fulfill, leaving $60,000 in gross profit. The true ROI here is 300%. If your ROI falls below 2:1, it’s a sign that your marketing is barely covering overhead costs.
This formula is perfect for quarterly or year-end executive reports, where you need to show tangible business growth.
Pipeline‑Based ROI Formula
For businesses with longer sales cycles, pipeline-based ROI offers a way to measure early performance. The formula is:
((Number of Leads × Lead‑to‑Customer Rate × Average Sales Price) – Cost) / Cost
Here’s an example: You spend $20,000 to generate 100 qualified leads. With a 15% close rate and an $8,000 average deal size, you’re looking at $120,000 in projected revenue – a forecasted 5:1 ROI, even before any deals are finalized.
To get the most accurate insights, align your evaluation period with your sales cycle. If it takes six months to close a deal, assess pipeline ROI over a rolling 12-month period to capture the full picture.
Channel‑Specific ROI Formula
For a more granular view, use this formula: (Channel Revenue – Channel Spend) / Channel Spend. It helps pinpoint which channels are delivering the best bang for your buck.
Take this example:
- Spending $3,200 on Google Ads generates $14,400 in revenue – a 3.5× return.
- Spending $2,100 on Meta Ads brings in $5,250 – a 1.5× return.
- A $200 campaign using emails that sell produces $8,600 – a massive 42× return.
Clearly, email marketing outshines the others here, making it an obvious choice for increased investment. Analyze paid campaigns monthly and longer-term strategies, like SEO, quarterly. For SEO, separating branded from non-branded search terms is crucial since branded clicks often come from customers already inclined to buy.
| Formula Type | When to Use It | Reporting Frequency | Key Advantage |
|---|---|---|---|
| Revenue‑Based | Executive reporting; final accountability | Quarterly or Annually | Shows actual business growth and profit |
| Pipeline‑Based | Real‑time budget decisions; long sales cycles | Monthly | Offers early performance indicators |
| Channel‑Specific | Tactical optimization; budget allocation | Weekly or Monthly | Highlights top-performing channels |
Tools and Frameworks for ROI Tracking
Once you’ve established your ROI calculator framework, the next step is selecting tools and methods that simplify and validate your data collection. The key is to streamline ROI tracking by integrating marketing, CRM, and financial data into one cohesive system. As Altior & Co. puts it, "The goal isn’t more tools, but a single, connected system that reveals the truth about what drives revenue". These tools ensure that the metrics feeding your ROI calculator are consistently gathered, processed, and analyzed to support revenue-focused decisions.
Strategic Pete‘s ROI Tracking Framework

Strategic Pete offers a structured framework designed to help B2B and SaaS leadership teams shift their focus from vanity metrics to what truly drives revenue. This framework is built on a three-layer metrics stack:
- Leading indicators reviewed weekly, such as MQLs (marketing-qualified leads) and cost per MQL.
- Pipeline metrics assessed monthly, including metrics like marketing-sourced pipeline and SQL-to-opportunity rates.
- Revenue metrics evaluated quarterly, such as closed revenue, CAC (customer acquisition cost) by channel, and the LTV:CAC ratio.
This tiered system ensures that teams focus on relevant metrics at the right time, avoiding data overload.
The framework also incorporates multi-touch attribution to map the full B2B buyer journey. When implemented correctly, multi-touch models can highlight the impact of efforts like webinars, which often deliver returns of 300% to 400% once properly credited. Strategic Pete collaborates with fractional CMOs and marketing leaders to implement U-Shaped or W-Shaped attribution models that accurately weigh key touchpoints. The findings are then presented in a concise, actionable format: "one page, six numbers, one recommendation".
Once this framework is in place, the next step is to select software tools that can transform your data into meaningful insights.
Software Tools for ROI Analysis
Your tech stack should handle every stage of the data process: collection, storage, transformation, and visualization. Here’s how you can structure it:
- Data collection: Tools like Segment and Google Tag Manager gather user behavior across multiple channels.
- Data warehousing: Platforms like Snowflake or Google BigQuery store this data securely.
- Data transformation: dbt (Data Build Tool) cleans and organizes raw data into usable metrics.
- Data visualization: Tools like Tableau or Looker Studio turn metrics into dashboards that your team can easily interpret.
Your CRM – whether it’s Salesforce or HubSpot – needs to integrate seamlessly with your marketing platforms to establish a "single source of truth". Incomplete or inconsistent CRM data can skew ROI calculations, so it’s crucial to maintain data accuracy. Companies that successfully build this analytics capability report a 25% increase in marketing ROI.
To maintain clean data, enforce strict governance practices. Use a universal UTM guide and ensure every campaign is consistently tagged. This prevents messy data from undermining your attribution models and ensures your ROI tracking remains reliable. If you want to go further, start with our guide to building B2B demand, then read about our B2B marketing services.
Conclusion
Once you’ve built a solid ROI calculator and equipped yourself with the right tools, it’s time to zero in on what truly drives results.
Tracking ROI effectively means focusing on the metrics that matter – like Customer Acquisition Cost (CAC), Lifetime Value (LTV), and channel-specific ROI. These insights can shift marketing from being seen as a cost to being recognized as a revenue generator. For instance, an LTV:CAC ratio of 3:1 or better signals to leadership that your growth strategies are financially sound. On top of that, channel-specific ROI data empowers you to reallocate budgets in real time, moving funds from weaker performers to channels that deliver stronger returns. Multi-touch attribution ensures you’re capturing the value of the entire buyer journey, rather than just the final click.
Integrating ROI tracking with your CRM and unifying your data removes the hassle of manual processes, making the entire system more efficient and reliable.
The ultimate reward? Credibility. When you present results in terms of revenue, pipeline contribution, and CAC trends, marketing is no longer just a cost center. Instead, it becomes a proven driver of revenue, earning buy-in for future budgets and a place in strategic decision-making.
FAQs
What data do I need to start an ROI calculator?
To make the most of an ROI calculator, start by gathering all your marketing expenses. This includes ad spend, subscriptions for tools, content creation costs, labor expenses, and agency fees. Then, track the revenue your marketing efforts have generated. By comparing these numbers, you can accurately assess the return on your marketing investments.
How do I handle long sales cycles in ROI tracking?
To measure ROI during lengthy sales cycles, it’s essential to use account-level tracking and lookback windows that match the sales timeline. This approach ensures you capture all the relevant touchpoints along the way. Tools like marketing attribution software and predictive AI can also bridge the gap between marketing activities and revenue over time, offering a clearer understanding of their impact. Make sure your attribution models are tailored to the duration of your sales cycle for more accurate insights.
Which attribution model should I use for B2B ROI?
When it comes to measuring ROI in B2B marketing, multi-touch attribution often stands out as the most effective approach. Why? It takes into account the various interactions a buyer has throughout their journey, providing a more complete picture of how marketing efforts influence outcomes.
Two popular models in this space are:
- Linear attribution: This model assigns equal credit to every touchpoint in the journey, ensuring no interaction is overlooked.
- Position-based attribution: Here, more weight is given to the first and last touchpoints, emphasizing the initial engagement and final conversion.
These methods are particularly useful for navigating the complexities of B2B sales cycles, making ROI calculations more precise and actionable.