
A marketing audit helps CEOs ensure their marketing efforts directly contribute to revenue, align with business goals, and eliminate inefficiencies. This checklist covers 15 critical areas to evaluate your strategy, from aligning marketing with business objectives to analyzing ROI, optimizing channels, and improving operational data accuracy, with expert leadership.
Key Takeaways:
- Align Marketing with Business Goals: Ensure your Ideal Customer Profile (ICP) matches actual buyers and connect KPIs like pipeline contribution and ROI to revenue.
- Evaluate ROI and CAC: Track metrics like Customer Acquisition Cost (CAC) vs. Lifetime Value (LTV) and use clean data for accurate ROI analysis.
- Channel Performance: Audit SEO, paid media, and content to identify underperforming channels and optimize high-impact areas.
- Customer Journey Mapping: Fix drop-off points in the sales funnel and ensure value propositions are clear across touchpoints.
- Content Strategy: Focus on high-performing content tied to revenue, and address gaps in the buyer’s journey.
- Operational Efficiency: Reconcile CRM and analytics data, fix UTM tracking issues, and eliminate waste in your MarTech stack. If these audits reveal significant gaps, it may be time to hire a fractional CMO to lead the turnaround.
- Budget Allocation: Prioritize high-ROI initiatives and cut underperforming campaigns to maximize returns.
This checklist provides actionable steps to align your marketing strategy with measurable business outcomes, ensuring every dollar spent drives growth.
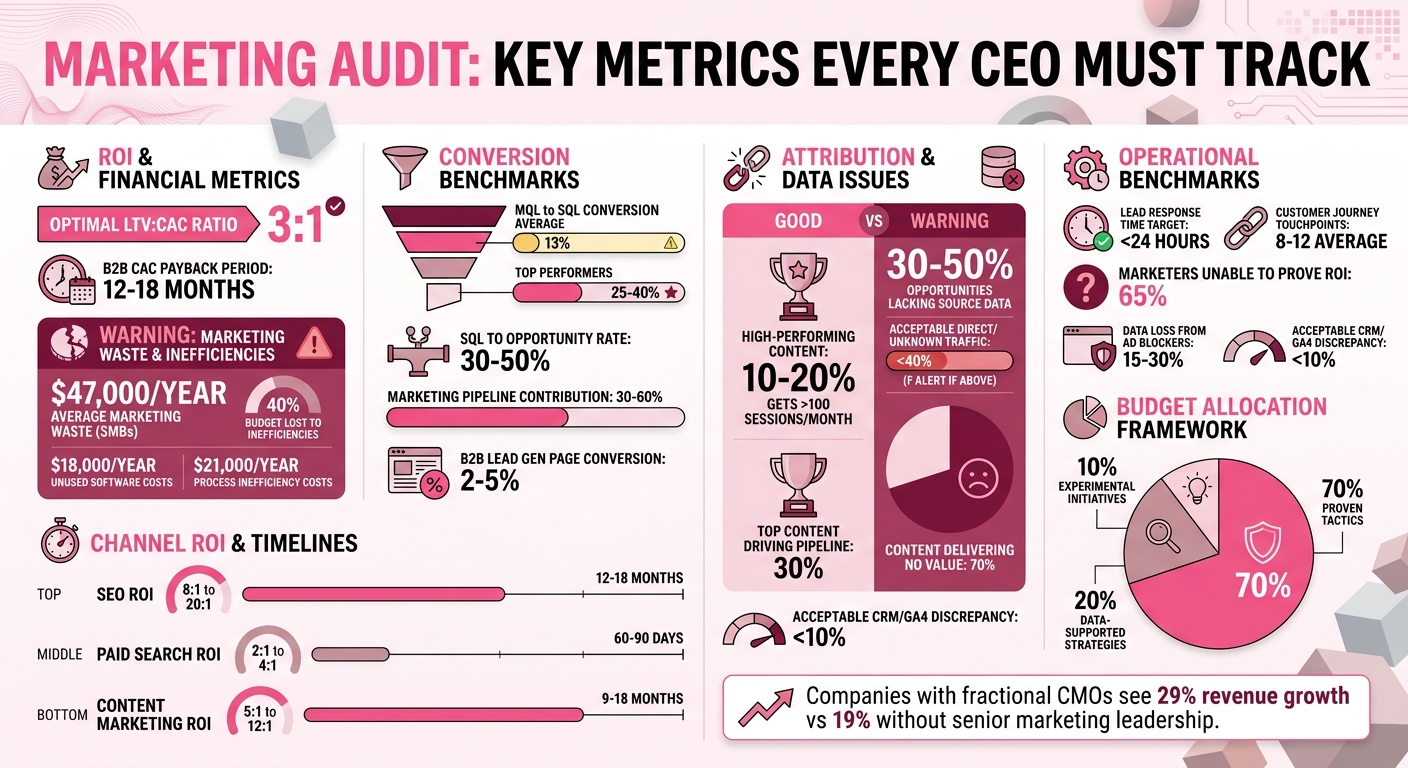
Marketing Audit Key Metrics and Benchmarks for CEOs
The 7 Step Marketing Audit Every Business Owner Should Run
sbb-itb-8f8c601
1. Business Goals and Marketing Alignment
One of the first things to evaluate is whether your marketing strategy aligns with your business objectives. Often, audits reveal a disconnect in which marketing teams focus on metrics unrelated to top-level priorities such as pipeline contribution, revenue impact, and ROI.
A common issue arises when marketing teams are rewarded for generating leads, while sales teams are judged on revenue performance (a common friction point when choosing between a lead generation agency and a fractional CMO). This misalignment can lead to situations where marketing appears successful on paper, but the business struggles to grow because the leads generated don’t convert into revenue. Another red flag is when the Ideal Customer Profile (ICP) defined by marketing doesn’t match the profile of customers who actually close deals.
To address this, start by comparing your stated ICP with the last 10 to 20 closed deals. If there’s a gap, it’s a sign your targeting may be off. Ensuring your ICP aligns with real-world customers helps ensure your marketing supports broader business goals. Additionally, make sure marketing KPIs – like pipeline contribution, MQL-to-SQL conversion rates, and cost per closed revenue – are directly tied to business outcomes rather than just tracking activity.
“If the marketing strategy is not aligned with the actual business, every downstream marketing decision is shakier than it looks.” – Dmitrii Gavrikov, who provides Fractional CMO Services
This foundational step ensures that your marketing efforts are focused on driving meaningful results and sets the stage for deeper analysis.
1.1. Marketing KPIs Connected to Business Goals
Marketing metrics should emphasize revenue impact over vanity metrics like awareness or lead volume. Key KPIs to track include marketing-sourced revenue, pipeline contribution, Customer Acquisition Cost (CAC), and the Lifetime Value (LTV) to CAC ratio. For sustainable growth, aim for an LTV to CAC ratio of 3:1. Depending on your business model, marketing should contribute between 30% and 60% of the total pipeline.
When it comes to conversions, the average MQL-to-SQL conversion rate is about 13%, while top-performing teams achieve 25% to 40%. SQL-to-opportunity conversion rates should range from 30% to 50%. If your numbers fall short, it may indicate issues with lead quality or the handoff between marketing and sales. Another common problem revealed in audits is that 30% to 50% of sales opportunities lack source attribution, making it difficult to measure the effectiveness of your marketing efforts.
Beyond the numbers, success also depends on how well teams work together.
1.2. Sales and Marketing Team Coordination
Even the best leads can fail if there’s poor coordination between marketing and sales. Misalignment often stems from conflicting priorities and a lack of clarity about what makes a lead “qualified.”
To address this, establish shared definitions for Marketing Qualified Leads (MQLs) and Sales Qualified Leads (SQLs), along with clear handoff protocols. Sales teams should engage leads within 24 hours, and both teams should hold weekly meetings to review lead quality and identify friction points in the funnel. As part of the audit, interview at least five sales reps to gather feedback on lead quality and the marketing assets they find useful during deals. This often reveals that some content drives traffic but does not contribute to closed revenue.
Aligning both teams around shared accountability for pipeline and revenue – rather than focusing solely on lead volume – helps eliminate the mismatched incentives that often lead to these challenges.
2. ROI and Performance Analysis
Once alignment is established, the next step is figuring out how to increase your marketing ROI and deliver profitable returns. This is no easy feat – 65% of marketing leaders admit they struggle to prove their financial impact, and with customer journeys averaging 8–12 touchpoints, it gets even trickier. To add to the complexity, over 40% of your pipeline might be attributed to “direct” or “unknown” sources, making ROI analysis a challenging puzzle.
“Marketing’s ROI problem is a measurement problem, not a performance problem.” – KISSmetrics Editorial
The solution? Start by integrating touchpoint data with CRM revenue data using a shared identifier. Every paid campaign, email, and social media post should have unique UTM parameters to ensure clean, trackable data. When reporting to leadership, skip vanity metrics like clicks or impressions. Instead, focus on the metrics that matter – pipeline contributions and revenue generated. The goal is to highlight what directly drives closed deals.
From there, dive deeper into key metrics like Customer Acquisition Cost (CAC) and individual campaign ROI to identify what’s really driving revenue.
2.1. Customer Acquisition Cost (CAC) vs. Lifetime Value (LTV)
The LTV:CAC ratio is one of the most telling metrics for evaluating whether your growth investments make sense. A solid benchmark is a 3:1 ratio, meaning every customer should generate at least three times the cost of acquiring them. If the ratio dips below 1:1, it’s a red flag that you’re losing money, and scaling up will only amplify the problem.
To calculate CAC accurately, include all marketing and sales expenses, then divide by the number of new customers acquired. And don’t just look at the first purchase – base ROI calculations on Customer Lifetime Value to capture the full potential of high-retention customers. For B2B companies, a typical CAC payback period ranges from 12 to 18 months.
It’s also crucial to segment CAC and LTV by tiers of your Ideal Customer Profile (ICP), such as Enterprise versus SMB. Different segments often have varying sales cycles and deal sizes. Tracking these metrics by acquisition cohort can reveal whether your marketing efficiency is improving over time. If your numbers are off, refining your ICP might help boost conversion rates and lower the cost per pipeline dollar.
Together, these metrics lay the groundwork for assessing whether your marketing investments yield long-term results.
2.2. Individual Campaign ROI
Beyond overall ROI, zoom in on individual campaigns to see their direct impact on revenue. Focus on measuring incremental ROI to ensure campaigns are truly driving additional conversions. For instance, retargeting ads might appear effective but could simply be intercepting buyers who were already planning to convert.
A balanced attribution model is key – give credit to both early and late touchpoints. For email and direct marketing, consider using a control group that doesn’t receive the campaign to measure its true incremental effect.
Different channels take varying amounts of time to deliver returns. SEO, for example, can deliver an ROI of 8:1 to 20:1 but often takes 12 to 18 months to reach its full potential. Paid search, on the other hand, typically delivers a 2:1 to 4:1 ROI within 60 to 90 days. Content marketing usually falls somewhere in between, with an ROI of 5:1 to 12:1 over 9 to 18 months. Understanding these timelines ensures you don’t pull the plug on campaigns too soon or overcommit to channels that aren’t performing.
“The CMO who frames marketing as a cost centre will always be fighting for budget. The one who frames it as a growth lever with measurable outcomes will usually win.” – Keith Lacy, Marketing Strategist
Lastly, don’t ignore those “direct” or “unknown” CRM entries—they often mask offline influences such as word-of-mouth or events. If more than 40% of your pipeline falls into this category, improving attribution tracking should be a top priority. Build three-scenario models (conservative, base, and optimistic) for your marketing budgets to quantify risks and opportunities. And keep a close eye on leading indicators like cost per MQL to monitor performance weekly. This helps you predict monthly pipeline and quarterly revenue more accurately.
3. Channel Performance and Optimization
Once you’ve confirmed that your marketing efforts are delivering a positive ROI, the next step is to figure out which channels are genuinely pulling their weight. B2B marketing often involves a mix of over 30 different channels, ranging from SEO to ABM campaigns. To make the most of your budget, it’s crucial to evaluate how each channel is performing.
Attribution models, like first-touch and last-touch, only give you part of the picture. As the Office of Experience puts it:
“The channel that gets credit for the conversion often isn’t the one that created the opportunity.”
A thorough audit should also account for the “dark funnel.” This includes word-of-mouth, events, and offline relationships that heavily influence deals yet often appear as “direct” or “unknown” traffic in analytics.
To get a clearer picture, create a channel scorecard that tracks metrics such as pipeline sourced, cost per opportunity, and conversion rates across all funnels. This can help you spot areas where you’re overspending on channels that generate leads but don’t close deals, or where underinvestment might be holding back revenue. Often, a small number of high-performing assets drive most of the results.
Different channels serve distinct roles. For example, organic social media may not typically drive last-touch conversions in B2B, but it plays a key role in building awareness and nurturing leads. Similarly, tools such as ROI calculators or implementation guides often outperform general thought leadership in driving revenue. Understanding these roles helps ensure you don’t cut channels that are vital to the overall customer journey.
Once you’ve established channel diversity, detailed audits of paid, organic, and conversion metrics can uncover more ways to optimize spending. This level of insight complements your overall ROI analysis by identifying where your budget translates into actual revenue.
3.1. Paid Media and Ad Spend Efficiency
When auditing paid media, ensure that targeting, bidding strategies, and creative assets are optimized for the investment. Metrics like Return on Ad Spend (ROAS), cost per opportunity, and cost per closed revenue by channel are key to identifying what’s working. Multi-touch attribution can help you understand which campaigns contribute to the pipeline, rather than just generating clicks.
Be on the lookout for attribution gaps – if over 40% of your traffic is labeled as “direct” or “unknown”, it’s a sign that tracking issues could be skewing your data.
For example, a typical audit of a $20M ARR B2B company often uncovers $50,000 to $200,000 annually in unused or overlapping marketing subscriptions. Focus on the top five campaigns that drive the most pipeline, as well as the highest-cost campaigns that fail to deliver results. Reallocate your budget to maximize efficiency.
3.2. Organic Search and SEO Performance
SEO isn’t just about keyword rankings. A thorough audit should also cover technical factors such as page load speed, mobile responsiveness, and site structure. Google penalizes sites that aren’t mobile-friendly, and slow load times can drive potential customers away before they engage.
Identify which pages are driving the most traffic and conversions. Often, a small percentage of content generates the majority of results. Repurpose these high-performing assets in other campaigns to maintain traffic while reducing resource demands. Additionally, map your content to the buyer’s journey – top, middle, and bottom of the funnel – to ensure there are no gaps where prospects might lose interest.
While SEO can deliver a strong ROI (typically 8:1 to 20:1), it requires patience. Results often take 12 to 18 months to fully materialize. Instead of pulling the plug too soon, track leading indicators like organic traffic growth, keyword rankings, and backlinks to gauge progress.
3.3. Conversion Rates by Channel
Dive into conversion metrics for each stage to pinpoint which channels drive qualified leads and revenue. On average, MQL-to-SQL conversion rates hover around 13%, while top-performing teams achieve 25-40%. SQL-to-opportunity conversion rates typically range from 30% to 50%. If your rates are below 20%, the issue may stem from poor lead handoff processes or unclear definitions between marketing and sales.
Channels that generate a high volume of MQLs but fail to convert them into SQLs might not be as efficient as they seem. Align sales and marketing on shared definitions for lead stages and the Ideal Customer Profile (ICP) to ensure that leads are nurtured properly and don’t slip through the cracks.
| Metric | Average Performance | Good Performance |
|---|---|---|
| MQL to SQL Conversion | 13% | 25-40% |
| SQL to Opportunity | – | 30-50% |
| Marketing % of Pipeline | – | 30-60% |
| Lead Response Time | – | < 24 Hours |
Ideally, marketing should account for 30% to 60% of your total pipeline. If you’re below this range, it could point to underperforming channels or attribution challenges. In many B2B organizations, 30% to 50% of opportunities lack source data, making a significant portion of the pipeline invisible in attribution reports. Fix these tracking issues first, then focus on improving channel performance.
4. Customer Journey and Experience Mapping
Once you’ve assessed which channels are driving results, the next step is to map out the entire customer journey – from the initial point of contact to the final purchase. The aim here is to uncover and fix any drop-off points along the way.
Break the journey into clear stages: Top of Funnel (Awareness), Middle of Funnel (Consideration), Bottom of Funnel (Decision), and Retention. Tools like GA4 funnel exploration can help you track drop-offs at each step, such as from the homepage to the pricing page or from a pricing page to a demo request. Heatmaps and session recordings can also provide insights into user behavior, highlighting issues like “rage-clicks”, shallow scrolling, or abandoned forms.
Don’t forget the “dark funnel.” Offline influences – like events, word-of-mouth, or personal sales relationships – often show up as “direct” traffic in analytics, obscuring critical touchpoints. If more than 40% of your pipeline is categorized as “direct” or “unknown”, it likely signals an attribution gap. This step helps connect channel performance with the broader customer experience.
4.1. Key Touchpoint Mapping
Building on your channel insights, refine your map of key touchpoints to make sure every stage highlights your core value proposition. Review each stage to ensure smooth transitions and clear calls to action. Start with first-touch attribution to identify which channels are bringing in potential customers, then use multi-touch attribution to see how channels support the nurturing process. Check recent closed deals to confirm they align with your current targeting strategy.
Ensure your primary value proposition appears above the fold on landing pages so visitors immediately understand your offer. Tailor landing page messaging to the buyer’s stage in the funnel. In many B2B audits, data shows that 30% of content generates nearly all of the pipeline, while the remaining 70% has little measurable impact. Consider retiring underperforming content that doesn’t contribute to your pipeline.
4.2. Friction and Drop-Off Points
Once touchpoints are mapped, the next step is to identify and eliminate friction that drives customers to disengage. Common issues include slow page load times, poor mobile usability, and confusing user interfaces. For example, if mobile and desktop conversion rates differ significantly, it signals problems with the mobile experience. Additionally, forms with more than four fields often see a sharp decline in submission rates.
Operational inefficiencies can also hurt conversion rates. Long response times, delays in lead follow-up (beyond 24 hours), and miscommunication between sales and marketing teams are frequent offenders. If your MQL-to-SQL conversion rate falls below 20%, it’s a clear signal that the transition between marketing and sales needs attention. Collaborate with sales leadership to uncover where the process breaks down – often due to misaligned definitions of lead stages or the Ideal Customer Profile (ICP). Accurate tracking, as discussed earlier, is key to identifying these problem areas.
Finally, put yourself in the customer’s shoes. Test the journey by filling out forms, subscribing to newsletters, and requesting demos to experience any friction firsthand. Plan a follow-up audit in 90 days to evaluate whether the changes you’ve implemented have improved your conversion metrics.
5. Content Strategy and Brand Messaging
Once you’ve mapped out the customer journey, it’s time to zero in on the content itself. Here’s a surprising stat: around 70% of content in most B2B organizations delivers no measurable value. A thorough audit can help you identify which pieces are working and which aren’t pulling their weight.
Tie your content directly to your sales pipeline. If your content team can’t show how their work impacts revenue, it’s a sign you need a strategic overhaul – not just more blog posts. Leverage your CRM data to figure out which materials your sales team uses to close deals. Talk to sales reps to uncover what content helps them succeed and where they’re compensating for gaps.
Categorize every piece of content by its role in the funnel – whether it’s targeting the top (TOFU), middle (MOFU), or bottom (BOFU). If most of your content is focused on awareness (TOFU) but you’re lacking case studies or other sales-enabling materials at the bottom of the funnel, that’s a gap you need to address. Also, take a hard look at your high-traffic pages – are they converting? Many businesses find that their most-visited pages lack clear calls to action, leaving potential leads untapped. Prioritize amplifying content that drives results.
“Content only works when it’s tied to pipeline. If your content team can’t show revenue impact, the strategy needs fixing, not more articles.” – Konabayev
Interestingly, only 10% to 20% of published content gets more than 100 organic sessions per month. Focus on your top-performing pieces and consider consolidating or retiring underperformers. As we look ahead to 2026, keep an eye on how Google’s AI-generated summaries might impact your content. These summaries can reduce click-through rates, even for high-ranking pages, so structure your content strategically to maintain competitiveness.
5.1. Content Gaps and Performance
To refine your strategy, start by identifying performance gaps. Inventory all your content and categorize each piece by traffic, conversions, and its stage in the funnel. Tools like Google Search Console and GA4 can highlight pages ranking between positions 11 and 20, which are prime opportunities for quick improvements. Also, check for keyword gaps where competitors are outperforming you, and address cannibalization issues where multiple pages compete for the same keywords.
Pay close attention to high-traffic pages that aren’t converting. These pages need immediate updates – add clear, relevant calls to action or adjust the messaging to better align with visitor intent. For reference, B2B lead generation pages typically convert at 2% to 5%. If you’re seeing lower numbers, your messaging may be off. Similarly, review your sales enablement materials. If your sales team can’t point to specific content that helps close deals, it’s time to rethink your approach.
5.2. Value Proposition and Brand Consistency
Your content’s performance is directly tied to how well it communicates your brand’s value. Ensure your value proposition is consistently reinforced across all customer touchpoints – whether it’s your website homepage, LinkedIn profile, ad copy, email subject lines, or sales presentations. Reviewing win/loss notes in your CRM can reveal which competitors are frequently mentioned, helping you refine your messaging to stand out with substance rather than relying on generic terms like “innovative” or “seamless”.
“If the company does not know who it sells to and what makes it different, every downstream marketing decision is shakier than it looks.” – Dmitrii Gavrikov, Fractional CMO, Otrenix
Your value proposition should be immediately clear on your website – ideally above the fold, so visitors don’t need to scroll to find it. Test the customer experience yourself by subscribing to newsletters or completing demo forms to ensure your messaging stays consistent. Keep an eye on your MQL-to-SQL conversion rates; if they’re well below the industry benchmark of 25% to 40%, it could signal a disconnect between your marketing and sales efforts.
6. Marketing Operations and Data Accuracy
Once you’ve assessed your marketing strategy and channel performance, the next step is to audit your operations and ensure your data is accurate. Reliable data is the backbone of smart decision-making, but audits often reveal gaps or inconsistencies. For example, if the lead counts in your CRM don’t align with conversion numbers in GA4 – and the discrepancy exceeds 10% – it’s a clear warning sign that your metrics might be off. This isn’t just a technical hiccup; it can undermine your entire strategy.
“If the data foundation is broken, every other finding has limited value.” – Dmitrii Gavrikov, who provides SaaS fractional CMO services at Otrenix
The first step is reconciling your systems. Compare the last 90 days of GA4 campaign data with your CRM records. If more than 30% of your website traffic is labeled as “(direct)” or “(not set)”, your UTM tagging likely needs attention. Standardizing your UTM parameters can reduce data fragmentation and help ensure better attribution. Without proper tagging, a large portion of your opportunities might lack attribution, making it hard to see the full picture of your pipeline.
Ignoring these issues can be costly. On average, companies waste 38% of their MarTech budget on underused tools. During audits, many businesses uncover 3–5 forgotten tools, often costing between $2,000 and $5,000 annually. To avoid this, create a detailed map of your tech stack. List each tool’s monthly cost, active users, and integration status. If you’re paying for features no one uses or understands, it might be time to cut them.
Laying this groundwork ensures that your CRM and analytics systems accurately reflect your marketing efforts.
6.1. CRM and Analytics Health
Your CRM should be the central source of truth for your pipeline, but it’s often plagued by duplicate entries, missing data, and broken integrations. To test its reliability, submit a website form and track the lead’s journey through your CRM and into email workflows. Does the data remain consistent across all platforms? If not, your decisions might be based on incomplete or incorrect information.
Server-side tracking is becoming essential. Between 15% and 30% of conversion data is lost due to ad blockers and browser restrictions when relying solely on client-side tracking. By implementing tools like Meta Conversions API or Google Ads enhanced conversions, you can recover this lost data. This adjustment can improve your Cost Per Acquisition (CPA) by 10% to 20% within just 60 days, as bidding algorithms receive better signals. Use GA4’s Realtime report and Google Tag Manager‘s Preview mode to confirm that conversion events are firing correctly – on user actions, not just page loads.
6.2. Marketing Automation and UTM Tracking
Once your CRM is in good shape, focus on how marketing automation and UTM tracking contribute to data accuracy. Automation should enhance the customer experience, not detract from it. Overusing automation can feel impersonal and might even reduce engagement or demo attendance rates. To avoid this, review your automated email campaigns by subscribing to your own newsletters. Are the messages clear and aligned with your brand’s value? If your MQL-to-SQL conversion rate is below 25%, it could signal misaligned lead definitions or handoff processes.
Next, pull the last 90 days of source/medium data from GA4 and check for UTM consistency. Standardize your naming conventions immediately if you notice discrepancies. If more than 40% of your pipeline sources are labeled as “direct” or “unknown”, you’re dealing with a serious attribution issue. Reassess your metrics after 90 days to confirm that data accuracy and pipeline visibility have improved.
7. Budget Allocation and Resource Productivity
Once you’ve established reliable data and streamlined operations, the next step is ensuring every marketing dollar works hard for your business. This checklist focuses on aligning your marketing budget with initiatives that genuinely drive revenue.
When your data is solid, take a close look at your marketing spend. Many CEOs find that their budget allocation doesn’t reflect actual performance. The 80/20 rule often applies here: a small number of initiatives deliver the majority of the results. Yet, businesses frequently spread resources evenly across channels, even when the returns are uneven.
For small to medium-sized businesses, the cost of inefficiency adds up quickly. On average, $47,000 per year is wasted on marketing inefficiencies. Nearly 40% of marketing budgets are lost to preventable issues like broken processes, misaligned teams, and redundant tools. For example, unused software licenses or duplicate platforms can cost around $18,000 annually, while another $21,000 is lost due to time wasted on unnecessary meetings, searching for assets, or navigating operational bottlenecks.
“The cost of inefficiency isn’t just what you spend – it’s what you don’t achieve.” – Bobos AI
To uncover misaligned spending, start by calculating your True Customer Acquisition Cost (CAC). This should include all marketing-related expenses – tools, agencies, headcount – as well as sales costs tied to customer acquisition. Compare this to your Customer Lifetime Value (LTV). A healthy growth benchmark is an LTV:CAC ratio of 3:1 and a payback period of 12 to 18 months. If your numbers fall short, it’s time to reassess underperforming investments.
If more than 50% of your budget is going to brand campaigns, you may be neglecting high-intent campaigns that drive conversions. Start by ranking your marketing initiatives by spend, then by business impact. Any misalignment between these rankings highlights where your budget needs adjustment.
7.1. Spend vs. Performance Analysis
Once you’ve identified potential inefficiencies, dig deeper into each channel and campaign. Review your spending over the past 12 months and compare it with performance metrics such as pipeline contribution, conversion rates, and revenue. This analysis often reveals “silent performance drains” – areas where spending yields little to no results.
Start with an audit of your MarTech stack. Create a spreadsheet listing each tool’s monthly cost, active users, and integration status. Then calculate ROI with this formula: (Value Generated – Total Cost) / Total Cost. If a tool isn’t delivering measurable value or is underutilized (e.g., fewer than half your team uses it), consider cutting it. Businesses often find three to five forgotten tools during audits, each costing $2,000 to $5,000 annually.
Next, assess the performance of your paid media campaigns. Pause low-ROI keywords and reallocate that budget to higher-performing formats. If your CAC has risen by more than 25% for two consecutive months, use that as a signal to reevaluate spending. Companies with top-quartile ROI tend to spend 8% less on paid social but invest three times more in attribution tools, enabling smarter allocation decisions.
Hidden costs – like agency markups (8%–15%), overlapping MarTech (5%–12%), ad fraud (2%–8%), and unused licenses (2%–6%) – can also drain your budget. Monitoring these quarterly can help recover 8%–15% of your budget.
“Every dollar you stop wasting on what didn’t work is a dollar you can invest in what will.” – The Office of Experience
7.2. High-ROI Initiative Prioritization
After identifying inefficiencies, focus on reallocating resources for the best results. Use a straightforward framework to categorize initiatives into four groups: Double Down (high ROI, scalable), Optimize (good potential but needs refinement), Test (new opportunities with promise), and Cut (low ROI, misaligned, or wasteful).
Visualize your findings using a 2×2 impact-versus-effort matrix. Start with high-impact, low-effort opportunities, like refreshing high-traffic pages to boost conversions or reallocating time to high-performing social media formats such as videos or carousels. These changes often require less effort than launching new campaigns but can still deliver meaningful gains.
Consider applying the 70:20:10 rule for budget allocation: allocate 70% of your budget to proven tactics, 20% to data-backed strategies, and 10% to experimental initiatives. This approach balances stability with innovation. For businesses in a growth phase, front-loading Q1 spending by 22% can help align with 90-day sales cycles, a strategy often used by high-performing companies.
Evaluate your MQL-to-SQL conversion rate. If it’s below 20%, there may be issues with lead quality or the handoff process. Redirecting budget toward better lead nurturing or sales enablement may yield better results than simply increasing top-of-funnel spending. Typically, marketing contributes 30% to 60% of the pipeline. If your numbers fall below this range, your budget likely needs reallocation.
Finally, commit to regular audits – annually for comprehensive reviews and quarterly by category. Follow a 30-day audit plan: spend the first week gathering data from your CRM, analytics, and financial records; the second week interviewing key stakeholders like sales and finance leaders; the third week synthesizing findings into actionable insights; and the final week presenting your priorities to leadership for approval. This structured process ensures you’re not just identifying inefficiencies but actively addressing them. For the wider picture, see our guide to hiring a marketing consultant. To see how we handle this for clients, read about consulting support from Strategic Pete.
Conclusion: From Audit to Action
An audit on its own is just a costly document. The real payoff comes when you take the findings and turn them into meaningful changes. That requires a clear plan, well-defined priorities, and accountability to see it through.
Start with Quick Wins – those easy-to-tackle fixes that make a big impact within the first 30 days. This could mean repairing broken tracking, refreshing high-traffic pages, or cutting ad spend on keywords that don’t drive results. These early actions can build momentum and often recover 10% to 25% of your budget. After that, focus on Strategic Projects that take more effort but deliver long-term gains. Think along the lines of refining your value proposition, improving conversion funnels, or aligning sales and marketing teams on lead definitions.
A 90-day action plan can help keep everything moving forward. Dedicate days 1–30 to evaluation and alignment, days 31–60 to implementing key strategies, and days 61–90 to fine-tuning and scaling successful initiatives. Check in at 30, 60, and 90 days to how AI is reshaping marketing metrics and ensure you stay focused on the goals. Most audits yield an ROI of 2x to 10x within the first quarter of implementation.
“Strategy without action is just expensive advice.” – Chelsie Wyse, Founder, TACT Marketing Strategy
For many CEOs, the issue isn’t spotting problems – it’s finding the time and leadership capacity to act on them. This is where a fractional CMO can make a real difference. Unlike consultants who hand over a report and walk away, a fractional CMO becomes part of your leadership team. They take ownership of marketing outcomes, work closely with your internal staff, and coordinate external vendors to ensure recommendations are fully executed. Companies that bring in fractional CMOs see 29% revenue growth, compared to 19% for those without senior marketing leadership.
FAQs
What data do I need before running a marketing audit?
To get a clear picture of your marketing performance, start by gathering data from tools like GA4, Google Search Console, ad platforms, and your CRM. Focus on key areas such as:
- Current marketing strategies: Assess which campaigns are active and their objectives. If no one owns that strategy, that is the gap a marketing strategist fills.
- Channel performance: Identify which platforms are driving traffic and conversions.
- Website analytics: Explore metrics such as bounce rates, session duration, and traffic sources.
- ROI: Measure the return on investment for your campaigns to see where your budget is making an impact.
- Customer insights: Analyze behaviors, preferences, and feedback to better understand your audience.
This data will help you pinpoint what’s effective, where you might be overspending, and areas for improvement in your marketing approach.
How can I tell which channels are driving revenue?
Start by conducting a marketing audit to evaluate how well your channels are performing against your business goals. Pay close attention to how your budget and resources are allocated across these channels. The key is to pinpoint which channels are delivering qualified leads and driving conversions.
Performing these audits regularly – ideally every 18 to 24 months – can reveal inefficiencies, spotlight your most effective efforts, and sharpen your revenue attribution. This process involves assessing how your content, technology, and analytics align with your broader strategic objectives. It’s about making sure every piece of the puzzle works together to maximize results.
When should I bring in a fractional CMO after a marketing audit?
If your marketing audit reveals serious gaps in your strategy, underwhelming performance, or a lack of senior-level expertise, it might be time to bring in a fractional CMO. This type of leadership can play a crucial role in aligning your marketing initiatives with your business objectives. Plus, they can implement strategies designed to deliver measurable, impactful results.